
This guide explains how to install, connect and use LISA Business Analytics.
Pre-Requisites
Confirm the following prerequisites before installation. Access and configuration may be completed by a Power BI or Business Central administrator.
- LISA Business is licensed and in use in Microsoft Dynamics 365 Business Central online.
- Each person who installs or views the app has the required Power BI licence.
- Your Power BI administrator permits template app installation in the tenant.
- You can access and authenticate to the Business Central environment containing the LISA Business data.
- The target company contains the subscription data that should appear in the reports.
What the app provides
- Annual, quarterly and monthly recurring revenue views.
- A clear Future Period split for distinguishing historical/current periods from forward-looking periods.
- Customer-level average monthly revenue, tenure and acquisition trends.
- Churned-customer revenue impact, tenure and churn trends.
Install, connect & Set up the app
- Complete the Future Actions & Power BI Setup within the Subscription Parameters page in Business Central (see more information below)
- Open the LISA Business Analytics listing and choose the option to install the app.
- Review the installation prompt and continue to create the app in your Power BI tenant.
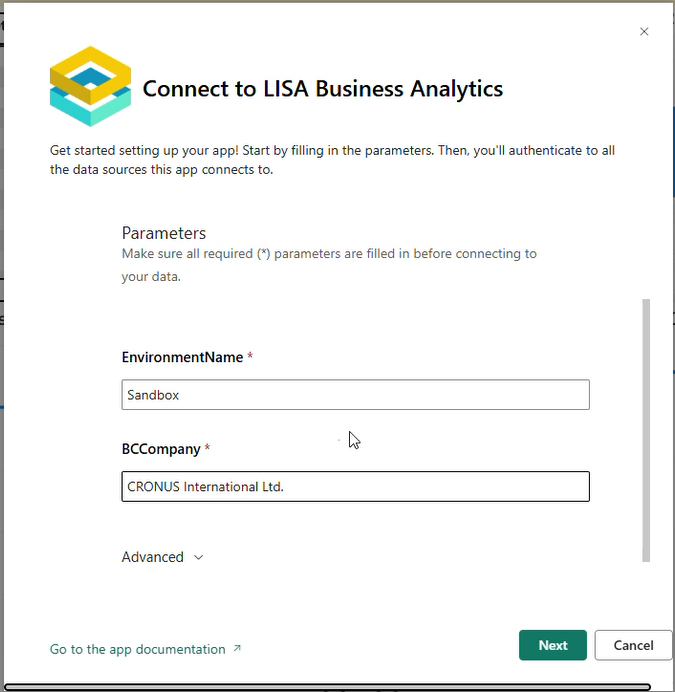
- When prompted to connect data, provide the Business Central environment and company details requested by the template.
- Authenticate using an account authorised to read the relevant LISA Business data.
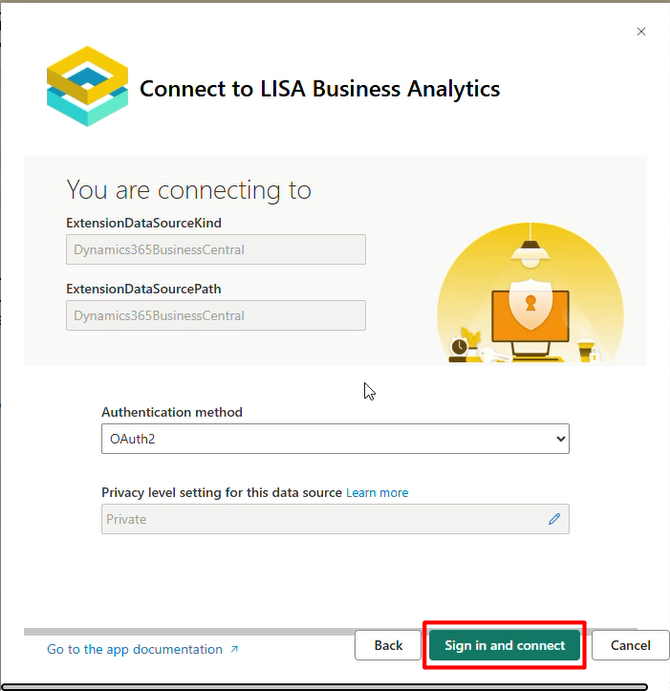
- Apply the connection and run the first refresh.
- Open the report and confirm that the three report pages display data.
Business Central Setup
Within the Subscription Parameters page, complete the following parameters.
| Section | Field | Description |
| Power BI | Power BI Report Start Date | Specifies the start date of the reporting window used when populating the Power BI revenue table. Actions with date ranges fully outside this window are excluded. |
| Power BI Report End Date | Specifies the end date of the reporting window used when populating the Power BI revenue table. Actions with date ranges fully outside this window are excluded. | |
| Automated Future Actions Process | Enable Automated Future Actions Process | Specifies whether the automated future actions process is enabled. When enabled, the system will periodically regenerate future subscription actions up to the configured horizon date. |
| Future Actions Process Time | Specifies the time of day at which the automated future actions process will run | |
| Future Actions Interval | Future Actions Process Time | |
| Future Actions Interval Unit | Specifies how many units of time must pass between each automated future actions run. | |
| Future Actions Horizon | Specifies the time unit for the future actions interval (Days, Weeks, or Months). | |
| Future Actions Horizon Unit | Specifies the time unit for the future actions horizon (Months or Years). | |
| Run Power BI After Future Actions | Specifies whether the Power BI revenue table population process should run automatically after a successful future actions generation. Uses the existing Power BI start and end dates from the Power BI group. |
Navigate the reports
Recurring Revenue
This page presents the same recurring-revenue picture at three levels of time detail. Each chart uses Revenue and splits the values by the Future Period status shown in the legend.
| Visual | Time view | Use it to |
| ARR | Year | Review long-term recurring-revenue direction and compare years. |
| QRR | Quarter and Year | Review medium-term movement and quarter-to-quarter changes. |
| MRR | Month and Year | Review the most detailed recurring-revenue movement and near-term changes. |
Customers & Revenue
This page links customer-level revenue and tenure with new-customer trends. In the current release, the page is not explicitly filtered to active customers, so this guide uses the report page name Customers & Revenue.
| Visual | Purpose |
| Total Monthly Revenue per Customer | Compares customers by Average Monthly Revenue and presents the highest values first by default. |
| No. of New Customers by Year | Shows long-term customer acquisition movement using Earliest Action Date at yearly level. |
| No. of New Customers by Month | Shows shorter-term customer acquisition movement using Earliest Action Date at monthly level. |
| Customer detail table | Shows Customer No., Customer Name, Lifetime Months and Average Monthly Revenue together. |
Churn
The Churn page focuses on customers with churn information and the associated average monthly revenue. The revenue chart and customer table explicitly exclude blank Churn Date values.
| Visual | Purpose |
| Average Monthly Churned Revenue per Customer | Ranks churned customers by the average monthly revenue associated with the customer. |
| No. of Churned Customers by Month | Shows churn movement at monthly level using Churn Date. |
| No. of Churned Customers by Year | Shows longer-term churn movement at yearly level using Churn Date. |
| Churned customer detail table | Shows Customer No., Customer Name, Lifetime Months and Average Monthly Revenue for records with a Churn Date. |